
Stock Market Indices and Reality
We thought it would be a good time to review and discuss the current movements this year of the major stock indices, how they work, and if they are really relevant to an individual investors’ personal situation. There is no doubt 2020 is a unique year, not just in terms of the pandemic, but also in terms of economic data and stock market indices. The major U.S. stock market indices such as the Standard & Poor’s 500 (S&P 500) and NASDAQ Composite are making headlines of now hitting all time highs. What does this really mean to you?
An important factor when comparing pure stock indices is your own risk level. If your personal risk level is anything but Aggressive, then comparing a portfolio with an all stock index is like comparing apples and oranges. In fact, as of this date, none of our risk levels hold 100% in equities/stocks.
Another important factor to consider is understanding how the various stock indices are calculated. The Dow Jones Industrial Average is a “price” weighted average, meaning the higher priced stocks move the average more than the lower priced stocks. Also, there are only 30 stocks in the Dow, so it is a very limited index focused on just those stocks.
The S&P 500 is a “capitalization” weighted average, giving the companies with the highest overall stock valuations receiving more weighting. We will address the impact of this strategy later in this article. This too can allow just a few stocks to skew the index based on stock valuations. This year is a great example of just how few of the 500 stocks can move the index.
A “Nifty” History Lesson
In the late 1960s, the “Nifty Fifty” was an index of stocks that were characterized by high multiples that were justified away by the belief of perpetual dominance and growth. A “high multiple” is simply when investors pay more for a company on future hopes, typically paying up for assumed growth of the business in the form of higher stock price. So, a company must far exceed these assumptions to have justified such a high multiple in the near-term. And unfortunately, this is not something that can be known in the present. During the early 1970s, investors completely ignored what value was being paid for this group of stocks and got swept away in the story that these businesses will forever reign supreme. And unfortunately for investors, most of these stocks within the Nifty Fifty fell dramatically from 1972 to 1974, which also brought large market index declines. Companies such as Polaroid fell a massive 91%.
In contrast to the mania during the dot-com bubble of 2000, the Nifty Fifty was made up of strong businesses that had good growth track records. So, it was not unjustified to believe the story. And even so, the story itself was actually true given enough time; however, it took three decades to be realized. In 1998, a professor of Finance at the Wharton School of Business, Jeremy Siegel, researched the returns of those investors that would have held on to the Nifty Fifty for roughly thirty years. In his paper, “Valuing Growth Stocks: Revisiting the Nifty Fifty” he concluded that buying these companies at the peak of 1972 would have performed right in line with the overall S&P 500 almost thirty years later, for the period from 1972 to 1998. So, it could be argued that investors were ultimately right for paying these high multiples given enough time. However, the valuation premium was amassed up front and better opportunities for those names did lie ahead. An interesting point: none of the large companies trading at the high multiples being discussed today even existed during the time of the Nifty Fifty; the ones that every headline claims will experience perpetual growth and dominance similar to the story then, such as Amazon, Apple, Tesla, Nvidia, Netflix and others. But also interesting, over half of the Nifty Fifty companies are publicly traded companies you can still buy today. The other half were either acquired or are no longer in business.
Stocks for the Long Run
Our main point in all of this is that we are strong believers in the long-term benefits of owning stocks, especially in accordance with a financial plan. However, we contrast that to also being value investors that passionately care what price we pay for those stocks. Just like we probably would have in the early ‘70s, we are urging caution to the valuations on specific securities being bought with no care for what price is paid. We believe the story being sold today about those companies, but we are not accepting of the valuations at which these stocks currently trade. We do believe these multiples can be justified, but only if you have several decades to wait. We believe better opportunities may be ahead for those specific names, and we’ll continue to cling to more appropriate valuations in client portfolios until then. And we believe when the pendulum swings, as it usually does, it tends to over correct and can bring opportunity. For today, the story champions nothing but “growth,” while tomorrow may bring a realization that this growth will take much time to materialize and comes with risks that are currently being ignored. As Charlie Munger said in the 2000 Berkshire Hathaway annual report during the height of the dot-com bubble, “the giddy participants all plan to leave just seconds before midnight. There’s a problem, though: They are dancing in a room in which the clocks have no hands.”
Diverging from the Indices
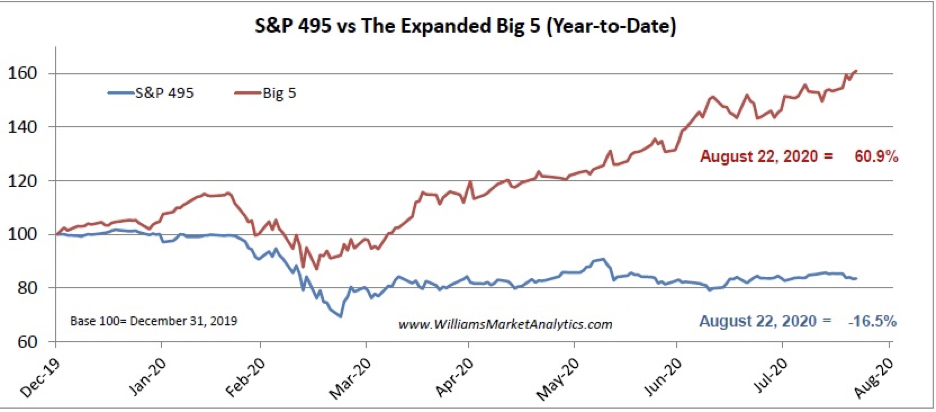
This divergence of valuations has caused some frustrations for value investors, as these top names have enabled the S&P 500 to soar to levels that is quite disconnected from the other components. Looking at the chart below, one can see how the index would have performed if these high flying names were stripped out: the hypothetical index would be down 16.5% this year as of August 22, 2020. That’s a pretty remarkable difference.
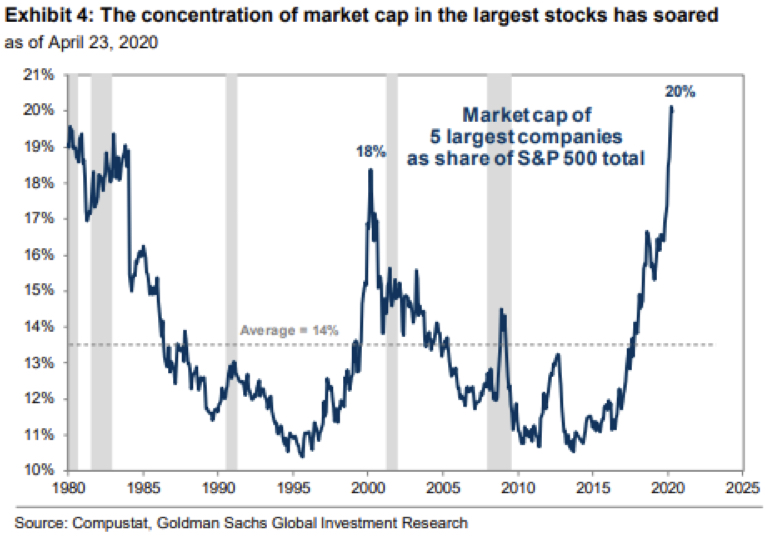
What is contributing to this disconnect? Well, four companies (Apple, Microsoft, Amazon and Facebook) now make up over 20% of the S&P 500. Looking at the chart below, it can be seen that this is not normal, and it is also higher than any time in the last forty years. If you are not invested in any of these index heavy weights, then your performance is likely to diverge when comparing your portfolio to the headlines tracking the indices, such as the S&P 500.
Again, we do agree with the overall longer-term thesis about these companies. However, just like the Nifty Fifty valuations, we believe it will take a substantial amount of time for some of these valuations to make sense. For the time being, we prefer to invest in what we believe to be better opportunities at present that offer substantially more balanced risk and reward metrics. We are not predicting the high multiple stocks to have an impending collapse. We just do not believe investors are being well compensated at these price levels in those particular “growth” names. We do not see it as false hopes of the dot-com era that witnessed revenue-less companies trading for massive valuations. Rather, we compare it more towards the days of the Nifty Fifty that saw good, defensible companies trading at lofty valuations. So, while we’re witnessing many valuations well above their dot-com highs, we do not correlate the current situation with that environment. We just believe that investors are seemingly inflating stock prices in the name of “growth,” and we’re asking, “But at what price?” The prices investors are now paying for some of these stocks have so much growth already assumed that the risk seems to tilt out of the investors’ favor. Fortunately, we’re still finding incredible values outside of these stocks.
We Do Like Growth: Just at the Right Price
When we use the term “value investors,” most tend to believe that we do not like growth, which is a misconception. We simply care what we’re paying for that growth. Where growth-related investors are much more willing to speculate on the future possibilities of that growth, we tend to balance that with the risks being assumed. As far as growth or even tech-based stocks, some clients do own Google as it is currently held in our Level 2 stock model at present. It is a large component of the indices as well, however, it does not appear to be trading at as lofty of valuations as some of the others given the company has been growing at 20%. We also hold companies like Oracle, SS&C, and DropBox in our various stock models. But, outside of pure tech related names, we love finding undervalued business that have growth potential that has not yet been realized. In most cases, we find stocks that we believe the core business is undervalued and the potential growth components are completely ignored. An example of this that all three stock models hold is H&R Block (HRB).
When you hear this name, most may think about individual tax preparers with retail shops, and you would be correct. However, HRB also recently made a major acquisition relative to the size of the company within the business accounting space, Wave Apps. After this acquisition, they announced small business banking services as well as the existing offerings of payment processing, bookkeeping services and even accountant coaching. In addition to this, HRB has put more focus on their core business and better utilizing their already existing tax preparer network with technology. Individuals can now have their taxes entirely done online either by themselves or with an HRB tax preparer, without having to enter their offices. Wave Apps has given HRB access to small business clients to extend their tax preparation offerings to, and it has only been a part of HRB since 2019. From a shareholder perspective, HRB pays over a 7% dividend yield and trades at an incredibly low multiple at present. It is one of the cheapest multiples we’ve seen for a relatively stable business.
Similar to the times of the “Nifty Fifty,” the headlines today are all focused on the current high-flying businesses as though they will be the only ones left standing, to buy them at any price, and growth is the only metric that matters. And to that, we do believe other businesses are more attractive than the majority of these current high-flyers, even though we find these companies to be great at what they do. We just cannot justify most of the current multiples. And if these stocks continue to soar, we would only become more concerned. So, as we asked in July, we continue to ask for patience as these few stocks find their way to even more new highs and dragging up the indices with them. No one knows when or if this current dance will end, but we will continue to focus on investments that are undervalued and keep diversified portfolios to help mitigate overall market risks.
As always, don’t hesitate to call us at any time if you have any questions or if we can be of further service. We hope all of you and yours have stayed safe and well this year.
God Bless,
Your TEAM at F.I.G. Financial Advisory Services, Inc.

Uncertainty and Volatility