
The current market environment, specifically the last few weeks, has been some of the most difficult to navigate. Interest rates have been rising, which is not an issue in moderation. However, these last few weeks saw rates surge. The currency markets have been in turmoil, with the US dollar remaining resilient. The pound witnessed a 5% drop in a day on fiscal policy announcements, reversing somewhat on the Bank of England’s monetary news. The US labor markets continue to be strong, which the market interprets as unfavorable due to the Fed’s arbitrary mission to “balance” the labor markets. As jobs remain robust, it implies the Fed will continue to be aggressive on rate hikes until unemployment eventually rises. It could not be more backward thinking. Historically, the Fed had sought to keep the dollar stable and strong. The US Dollar has strengthened dramatically against almost all developed currencies, yet the Fed remains determined to raise rates. At the time of writing this, there are only three currencies higher relative to the dollar which are the Mexican Peso, Brazilian Real, and, ironically, the Russian Ruble. The Ruble has risen over 20% relative to the dollar this year, driven primarily by Russia’s mandate of energy purchases occurring in their own currency.
For portfolios, this has caused dramatic gyrations. Since beginning to overweight tech-related investments, most portfolios saw a surge to the upside by August and a rather extensive outperformance of benchmarks. This reversed in recent weeks from both sharp declines in both bond and stock prices. The US 10-year Treasury yield surged over 100 basis points (one full percentage) in August and September, which seems unlikely to continue. We had previously believed longer-term rates would stabilize this spring after seeing the 10-year hit 3%. We still hold this opinion. As recently discussed, we remain bullish as valuations remain too compelling in many specific stocks. If people were to sell $100 bills for $50, it would be logical to conclude that it can only go on for so long until lines would form to take advantage of the bargain price. If they start selling for $20, it becomes only more irrational. As we’ve often done in the past, we want to give another specific example of a position we favor, Zillow Group (ZG).
Zillow operates the popular real estate app which most of you are familiar. The app is their core revenue driver when excluding their home-flipping business. The company thought it would have a competitive advantage with all the data on its platform to flip homes. However, this thesis proved wrong and it has severely struggled because of this choice. Home-flipping is incredibly capital intensive, which is the exact opposite characteristic of a tech business. Fortunately, Zillow is now unwinding that strategy and getting back to basics. Once this poor venture is offloaded, the business is extremely profitable and has $1.6B in net cash, nearly 25% of its entire market capitalization. Opendoor, once a competitor, will pay Zillow for referrals to its platform as well. This will be a significantly better avenue of revenue streams than tying up capital in attempting to flip homes. Additionally, the company also earns revenue on mortgage originations, which have been impacted slightly by the recent “slowdown” in the real estate markets, which brings us to our next topic of discussion: the housing market.
Let’s Talk Housing Markets
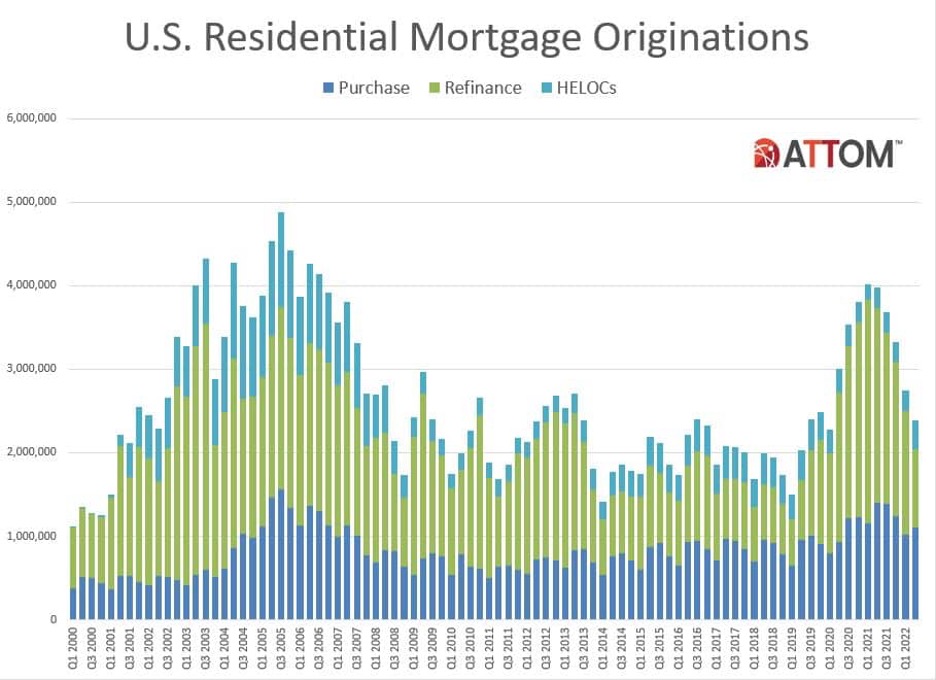
With so many questions coming in about the housing market lately, we felt it important to address the current environment in more depth than our previous comments. Given the headlines as well, you’d think we’re in one of the worst housing crises ever. While, yes, housing has “cooled,” we would like to bring a bit more perspective. For banks in general, one area that has been dramatically impacted is refinancing. Refinancing has been the majority of the decline related to mortgage activity, which can be seen in the chart below. It has an undoubtedly economic impact concerning banks, title companies, mortgage brokers, and others. However, it does not set-off warning bells, in our opinion. Unlike the 2008 housing crisis when the US saw a surge in HELOCs (Home Equity Line of Credit), borrowers have predominantly used refinancing to spread the loan value over the life of the mortgage. Excessive HELOC lending can potentially impact the markets as borrowers would have to face the music sooner than spreading the cost into their mortgage. HELOCs, which would be concerning in a rising rate environment, have remained relatively stable over the last decade and do not show any elevated concerns.
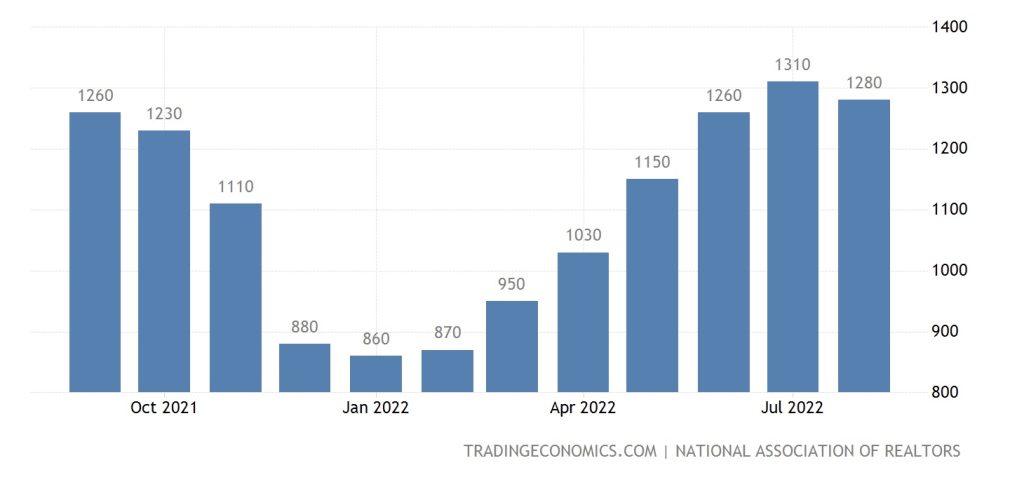
For whatever reason, there was recently a surge in home buying, which has also slowed. From the surge, we also saw one of the largest price spikes in history, so a price decline should not be concerning but instead healthy. While current headlines read, “US housing market to see the second biggest home price decline since the Great Depression,” which completely ignores the astronomical rise in housing we just recently witnessed. In our opinion, one important metric to look at is housing supply, which is how many homes are available for sale. This is one statistic is spun to be negative by saying, “housing supplies have jumped 50% since January,” with a graphic similar to the one below.
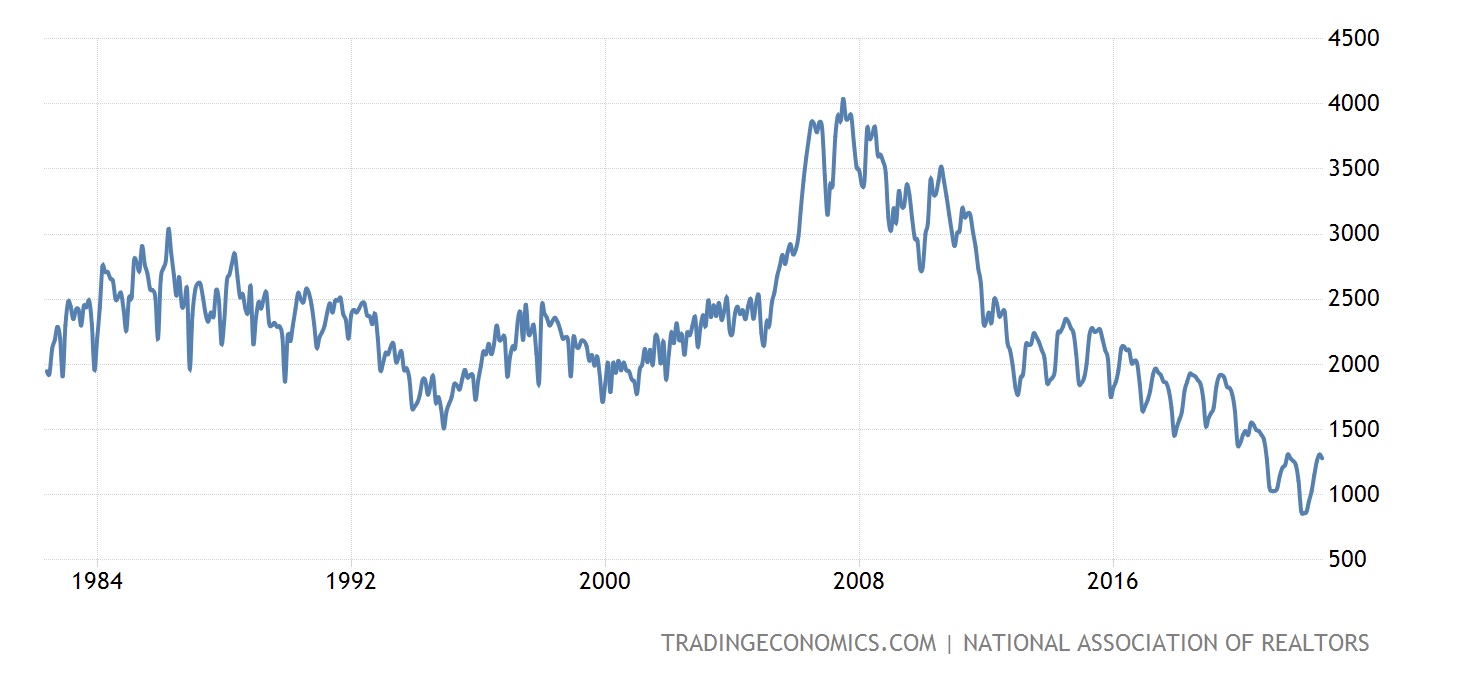
Seems concerning, right? While this is true, it is quite misleading. If we take a step back and look at where we are relative to a longer-term view, it paints an entirely different story. Context is very important. The chart below shows the last forty years of US home inventories. Compared to 2008, the US has one-quarter of the homes available for sale, yet the population has grown 10% since then. Comparing the same age cohort to 15 years ago, the US has 3.6 million more people in that first-time home buyer age group, ages 30 to 35, spurring near unprecedented additional demand. This excess demand could eventually lead to a supply glut as builders may overbuild trying to keep up. However, it seems we are far from this occurring anytime soon. So, while headlines read, “home inventories rise,” it is technically true. However, taking a step back, it’s clear to see we’re not experiencing any supply glut like in the past. In fact, it appears to be a supply crunch still exists, even with the surge in prices.
The recent “rout” in housing has made many ring the alarm bells of another 2008 housing crisis unfolding. The median home price has exploded to near-term unsustainable levels, and we have iterated that a price decline should be welcomed. The median sales price in the US jumped from $327,100 in the fourth quarter of 2019 to now a staggering $440,300. Goldman Sachs issued their “dire” opinion on the housing market by after surging more than 30%. That move is quite unprecedented; however, we did see a surge in prices leading up to 2008, which is what many point to as the concern for what lies ahead. However, let’s look at the backdrop and what supports these higher levels today compared to then. We undoubtedly do not believe this is a housing crisis, unlike in China, which is experiencing one.
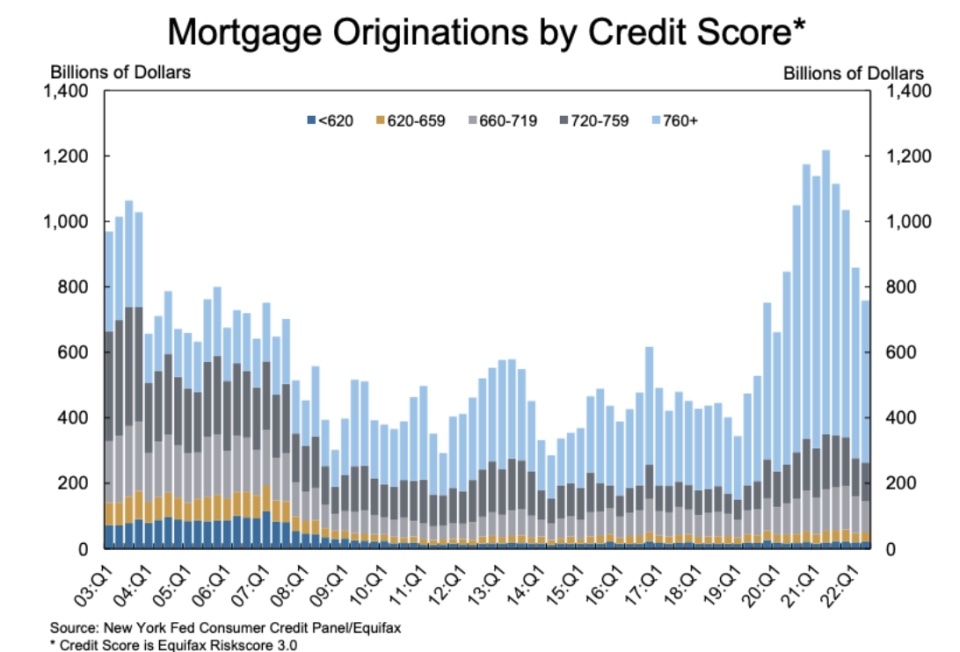
We’ve been vocal about how we believe the average American is doing better than ever before, despite the endless pessimistic rhetoric that Americans are somehow worse off. The consumer is in good financial condition, but additionally, banks are also in stronger positions than during the past crisis. Looking at the chart below, the majority of mortgages lent over the last two years have predominantly been to the highest credit rating consumer, compared to a much small percentage from 2004 to 2007.
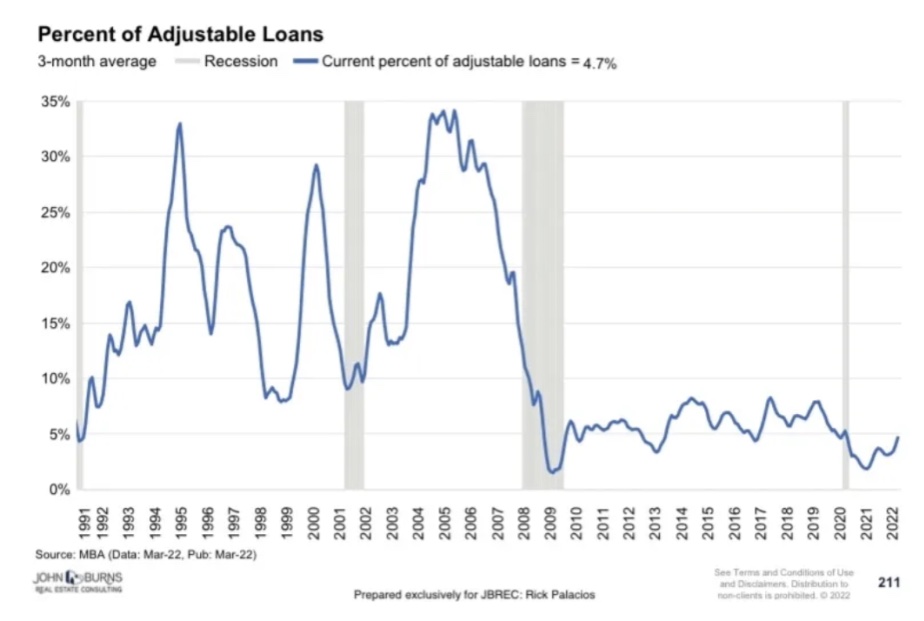
More important than credit score would probably be the types of loans as well. Back before the financial crisis, many loans were adjustable rates, roughly a third of the loans made. This would expose the consumer to any rise in rates. However, this time, the consumer is insulated by the current rate spike as only one in twenty loans are adjustable now. This can also be seen by the balances of loans at which rates. Currently, nearly 80% of loan balances remain at a rate under 4%. Obviously, this will rise as more new loans come online in the coming years if rates remain at these levels.
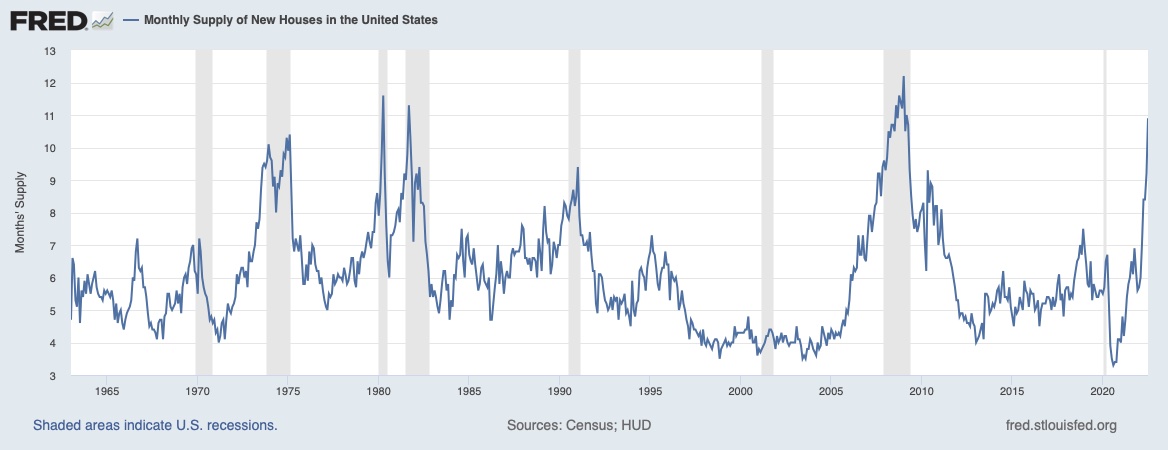
One “concerning” metric looks specifically at months to churn out the entire new home inventory. It is near one of the highest levels, looking at the chart below. However, this lends credence to our belief in a ripple economy, illustrating a collapse in 2020 followed by a surge, which is overshoots and leads to a temporary lull until another pick-up occurs, hence “ripple.” In the chart below, all else equal, if new home sales fall, this chart will rise. With the ripple economy in mind, this chart isn’t all surprising, and when given more context from the housing supply as a whole, as discussed above, it removes most concerns. Ironically, these gyrations occurred in the early 1980s, which has many overlaps with the current environment. We would expect this statistic to come down sharply, no different than how quickly it rose.
We previously wrote about how we believed we were in a housing boom driven predominantly by demographics, which had been accelerating since 2018 in addition to a surge in household formations. A great deal of this continues to be drowned out by the pandemic. However, is it a coincidence to see a housing boom during a time that the average first-time home buyer is 33, which is also one of the largest population cohorts in America?
We adamantly conclude that the fundamentals behind the housing market currently are stable and not concerning, unlike during the financial crisis. Additionally, as value investors, we look at valuations and what seems expected. Combing through most home builders, you’ll find valuations that are extremely suppressed, which is the market saying either current earnings are not sustainable and will fall or substantial risks exist in these companies.
The point is the market has already priced in the current concerns. It did this in 2006, when most home builders’ stocks saw massive price declines that summer, well before the financial crisis. The valuations baked into most of these stocks now is more severe than back then. We do not believe this to be reasonable as the overall housing fundamentals seem strong for the future. We have not yet built positions in home builders or housing suppliers, but we continue to monitor the space actively. But, we use this as an example to show negative expectations are already priced in. Our job is to continue to provide you with the facts to help maneuver through all the hype and headlines and to keep you informed. As always we are here to serve and answer any of your questions or concerns.
Please don’t hesitate to call or email at any time.
God Bless
Your TEAM at F.I.G. Financial Advisory Services, Inc.

Uncertainty and Volatility