Easter Holiday Hours
We wish you all a very blessed and Happy Easter this coming weekend. Friday the US financial markets are closed in observance of the Good Friday holiday. Our offices will be closed as well. We will be back on Monday morning, April 18th for business as usual. REMINDER: Since AXOS and the markets will also be closed Friday, any distribution requests from investment accounts will be delayed by one business day due to the Friday closures. Also, the tax filing deadline without an extension this year is Monday, April 18th.
An Incredibly Normal Recovery
Despite the bombardment of “unprecedented” headlines and countless experts decrying an imminent recession, economically speaking, this recovery has been incredibly… well, normal. We had expressed the need for the Fed to taper their stimulative actions last fall, so it comes as a welcome action that they announced a modest rate hike as well as the intention to begin rolling off assets. Even in 2020, we reiterated our concerns about inflation that no one seemed to care about. Now, inflation is here, and it has become less of a concern. We believed excessive government stimulus spurred the fire. However, we also witnessed a healthy housing boom backed by a strong consumer, an extremely tight labor market, and a low supply of homes. We continued watching metrics, concluding that Americans are in better shape than ever before.
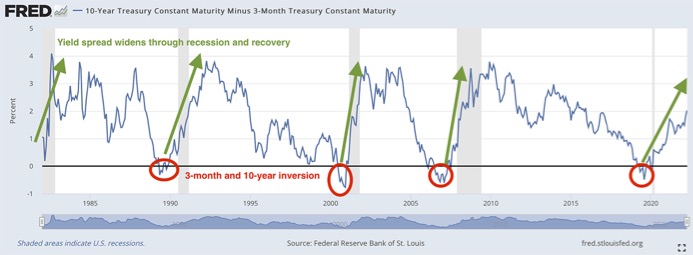
Back in June of 2019, we began issuing a bit of caution from signals we were seeing in what is known as the “yield curve.” Essentially, a yield curve compares interest rates of more than one bond duration. For example, comparing the US 2-year yield to the 10-year yield. In a normal environment, you would expect the shorter duration bond, such as the 2-year yield in that example, to be lower than the longer-term duration yield, the 10-year. For a moment, the 2-year yield did jump above the 10-year, sparking many to cry for an inverted curve and an imminent recession. However, our favorite curve to watch is the 3-month and 10-year yield, which we will walk you through below.
Since 1980, this indicator has accurately predicted an impending recession 100% of the time. While there have only been four recessions since then, we still believe that lends to its credibility of reason to proceed with caution at the very least. Currently, it is behaving just as it did in every recession before by expanding. The spread between the yields sits at 200 basis points (2%) right now, which, if it follows every recession of the past, we should see it extend further to 300 basis points or a full 3% difference. And even though the rise has seemed fast, the spread expansion has been at the slowest pace relative to the last four recessions.

Seeing a 300-basis point spread would imply a US 10-year Treasury yield over 3%. The US 10-year yield is almost 2.8% today, so we’re nearly already there. So, while many cry foul about rising interest rates, we do not find it much of a surprise. For client portfolios, we have started reaching out to the far end of the yield curve and have started allocating to long-term bonds at this time. We believe that the longer-duration yields will stabilize and potentially fall as we continue embarking on what appears to be a normal recovery. And while bonds have been a difficult market so far this year, we expect that to subside by year-end and lead to relatively stable returns for our more conservative clients. The move higher has been swift, but if you pull back and look at current rates on a historical basis, interest rates remain low.
We do not exclusively follow one indicator. The interest rate spread analysis above is simply one indicator of many, however, almost all of them lead to the same conclusion: We continue to be in a recovery, and the economy remains strong despite decade-high inflationary pressures. We will keep you posted.
We are here to serve all of you on a daily basis, and if you ever have any questions or concerns, please don’t hesitate to call or email at any time.
God Bless,
Your TEAM at F.I.G. Financial Advisory Services, Inc.
This update expresses the views of the author(s) as of the date indicated and such views are subject to change without notice. F.I.G. Financial Advisory Services, Inc. (F.I.G.) has no duty or obligation to update the information contained herein. Further, no representation has been made, and it should not be assumed, that past investment performance is an indication of future results. Moreover, wherever there is the potential for profit there is also the possibility of loss. This information is being made available for educational purposes only and should not be used for any other purpose. The information contained herein does not constitute and should not be construed as an offering of advisory services or an offer to sell or solicitation to buy any securities or related financial instruments in any jurisdiction. Certain information contained herein concerning economic trends and performance is based on or derived from information provided by independent third-party sources. F.I.G. believes that the sources from which such information has been obtained are reliable; however, it cannot guarantee the accuracy of such information and has not independently verified the accuracy or completeness of such information or the assumptions on which such information is based. F.I.G. made attempts to show sources and links to that data, when possible. However, F.I.G. cannot guarantee or be held liable when accessing those links, as it is not the property of or maintained by the author(s). This update, including the information contained herein, may not be copied, reproduced, republished, or posted in whole or in part, in any form without the prior written consent of F.I.G.


Uncertainty and Volatility