
2019 is Almost Half Over!
It’s hard to believe that 2019 is already almost half over! With the end of the first half and second quarter approaching, if you have not yet scheduled a personal review this year, please be sure to contact us. We can schedule your personal review either in-person or via the online option with Go-to-Meeting. We always want to review all our clients plans at least annually, if not more often. Mid-year is a great time to look at your overall personal situation, discuss risk, and update your financial plan. Call or email us today!
The Markets:
May saw the major U.S. stock indices move lower, with the Dow Jones Industrial Average declining by 6.32% while the Standard & Poor’s 500 Index fell 6.35%. The NASDAQ Composite fell 7.78% for the month. Fears over additional Tariffs and the interest rate environment increased the uncertainty over future economic growth.
Last month we said, “Investors remain optimistic that U.S. and Chinese trade negotiators will come to terms on an ever-elusive trade agreement.” Unfortunately, “ever-elusive” continues to be the operative word.
On May 5, President Trump surprised investors by tweeting that tariffs on some Chinese imports would rise from 10%-25%. Why? According to several news reports, China had backed away from previously agreed-upon terms. Not surprisingly, China retaliated and there has been no shortage of incendiary rhetoric between the two economic powers.
At month’s end, Trump surprised everyone by levying new tariffs on Mexico. His stated plan is that all goods will be subject to a 5% duty, rising to 25% in October unless Mexico gets a handle on the surge in migrants coming into the U.S. The announcement of a new barrier between Mexico, which is the 2nd largest U.S. trading partner behind Canada (U.S. BEA), was nothing short of a bombshell that further exacerbated economic uncertainty.
Still, stock selling has been relatively subdued, with the broad-based S&P 500 Index down less than 7% from the April 30 high. Placed in a historical context, the average maximum annual peak-to-trough drop in the S&P 500 Index from 1980–2018 has been nearly 14% (LPL Research, St. Louis Federal Reserve). Today, investors are unsure how to model and price in economic activity going forward; hence, the short-term reaction is to move away from stocks and into the safety of Treasury bonds. The situation is fluid right now. Best case Chinese scenario: an enforceable deal that helps level the playing field and protects U.S. technology and intellectual property. More likely, negotiations could drag on for months, and investors will be forced to adjust to a new normal. It’s not optimal, but it is reality. Additionally, the threat of tariffs on Mexico is sub-optimal from an investing and economic perspective.
Bond prices rose sharply, with yields for longer term bonds falling over the past month. (Bond prices rise when interest rates fall) The yield for the 10-year U.S. Treasury hit a 21-month low yesterday, closing at 2.085%. (MarketWatch) The national average rate for a 30 fixed mortgage now sits at 4.03%, while the 15-year fixed rate is 3.29%. (Bankrate.com)
We have continued to be cautious over the past year and have not had any of our portfolio risk levels invested in the maximum allocations for equities/stocks for some time now. The bond/fixed income portion of our client portfolios performed very well in May as did the REIT (Real Estate Investment Trusts) positions we hold. This diversification helped limit the downside all our risk levels experienced in May. We are very pleased with the overall net results in our portfolios over the past three years given our cautious stance starting in mid-2017. We have been monitoring the markets closely and certain indicators over the past month, and a cautious stance remains warranted based on the current yield curve.
An “inverted yield curve” is when short term interest rates are higher than longer term rates. This occurred last month when the yield for the 10-year U.S. Treasury dropped below that of the 90-day T-Bill. The yield for the one-year Treasury dropped below the 10 year yesterday as well. The yield for the 10-year U.S. Treasury is currently 2.07%, while the 90-day T-Bill is 2.35% and the 1-year U.S. Treasury is now at 2.11%. (Treasury.gov) The last time we saw this was 2006. Below is a chart showing the yield curve both currently and just one year ago. The blue line is what the yield curve should look like under normal conditions. The black line is today.
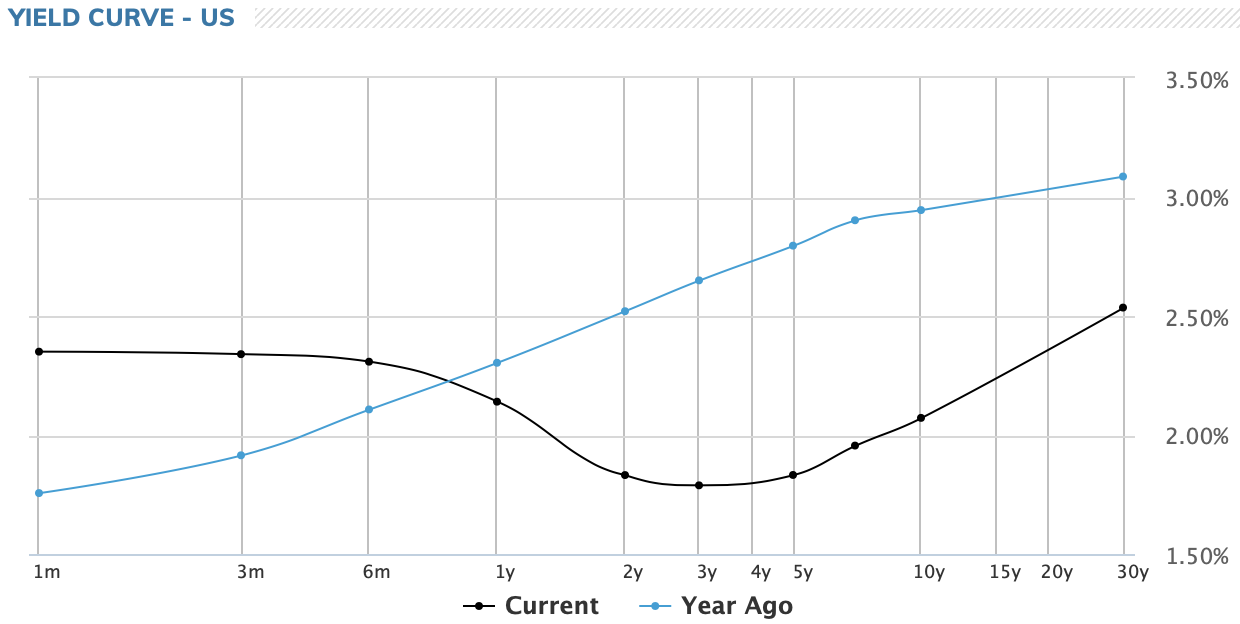
Source: MarketWatch
What’s this mean? When we have seen an inverted yield curve in the past, it has been a fairly good indicator that a recession may lie ahead. The question is when and how long? It could be in the near future or more than a year out. It can also reverse itself and the yield curve could become normal again if short-term rates fall below the longer-term rates. If the FED were to lower the short-term rates again, the picture could change quickly. We will monitor this closely, but at present, we are willing to err on the side of caution overall until we see this indicator move back to normal. This does not mean a sharp stock market decline or a recession is imminent soon, but caution is warranted. During a recession, which is a normal part of the economic cycle, stocks often underperform fixed income in general, so it appears the prudent approach at present is to position a higher than normal allocation to bond/fixed income in all risk categories for more stable returns moving forward. We will keep you posted.
What should you do now? Control what you can control. You can’t control the stock market, you can’t control headlines, and timing the market isn’t a realistic tool. But, you can control your long-term goals and plans. Your personal plan should consider your time horizon, risk tolerance, and financial goals. There is always risk when investing, but we are here to assist you in reviewing your portfolio and risk level while keeping your personal financial goals in mind.
As we’ve said before, having and updating a specific long-term plan in place is also designed to remove the emotional component. You know, the one that encourages the average investor to sell near the bottom out of fear and encourages greedy buying when stocks are soaring. As always, we are here to answer any of your questions or concerns and encourage you to continue to review and update your planning on a regular basis.
God Bless,
Your TEAM at F.I.G. Financial Advisory Services, Inc.

Uncertainty and Volatility