
Summer is Coming to a Close!
If you have not yet scheduled your personal update/review for this quarter, please do so now. We can discuss the current investment environment and update you on your overall investment portfolio as well as your long term overall financial plan. Call us today!
Swift and Extreme Market Movements/Rotation:
- Recent market volatility has dramatically shifted across various sectors, including semiconductors and regional banks.
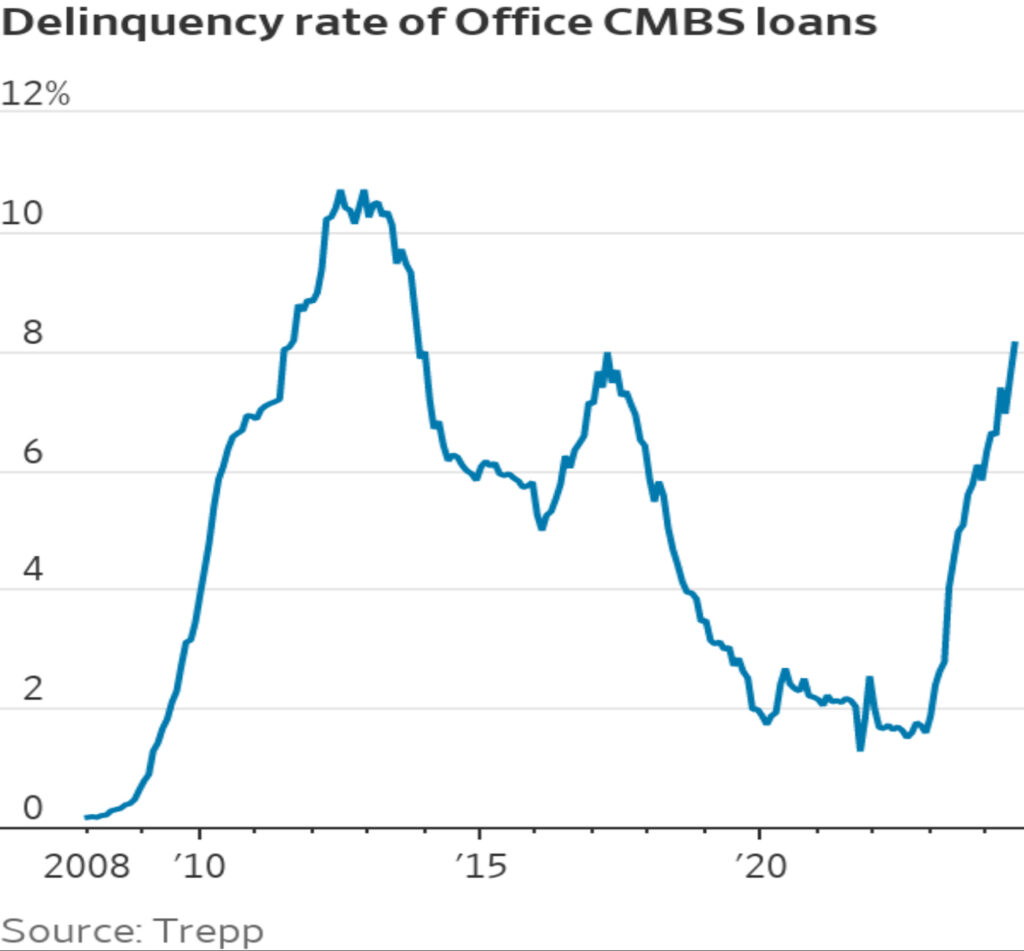
- Commercial real estate delinquencies are at their highest levels since the financial crisis in 2008-2009 as the Fed keeps rate flat while signaling for a September cut.
- Unexpected market movements include gains in REITs and a brief surge in small caps relative to large caps, which has mainly reversed in a matter of days.
- Economic indicators, such as the Sahm rule, suggest a potential recession has begun, with rising unemployment and declining job growth.
- Portfolio diversification and frequent adjustments are being made to navigate these unusual market conditions.
The last few months in the markets has seen sharp sporadic gyrations, especially when narrowly focusing on specific sectors and industries. For example, after a relentless rise, semiconductors witnessed their worst one-day decline with no specific news since March 2020, during the chaos of the pandemic. Most of the market sold off in areas previously performing quite well, witnessing some strength in areas that had been underperforming. Specifically, small caps and regional banks saw a historic rise relative to the S&P 500. However, nearly a few days later, much of the gain had already been reversed. The tech sector, in general, has seen severe declines over the last few weeks, not experienced since 2022.
One specific area of concern that we’ve discussed for the last year is the commercial real estate market. The Wall Street Journal posted an insightful chart showing the escalating delinquencies and severe uptick in foreclosures. Below, a chart shows commercial office-related loan delinquencies rising and reaching the highest levels since the financial crisis in 2008-2009.
 Wall Street Journal
With this information, can you guess some of the strongest-performing sectors of the market over the last month? Surprisingly, regional bank stocks and office REITs saw large spikes higher in price. Although, regional banks have now given back the majority of their gains. REITs have performed poorly in the last few years. But, over the last few months, almost all REIT categories, such as office, industrial, and healthcare, saw gains except for hotels. The market continues to see severe weakness in travel-related industries, such as hotels, bookings, and airlines, and we continue to avoid these areas for portfolios.
The gyrations we’re witnessing in the markets are more parallel to a major crisis, not a calm market or a “soft landing.” For example, DXJ, a Japan-focused ETF we utilize for portfolios from time to time, was up almost 35% year to date, which has now fallen to being up less than 10%. Japan’s markets have witnessed a 15% decline within two days on a US dollar basis! There has not been a two-day decline like this since 2020, during the pandemic. And currently, no economic event has occurred, at least yet. We can’t help but believe something much larger is now happening, or at least the potential for one. Our concerns had been eased when we witnessed the markets bid up small banks, which had been a major sore point over the last year since the collapse of Silicon Valley Bank. However, with most of those gains now taken back in a few days, we remain on alert as we continue monitoring the situation.
Earnings reports have been somewhat mixed. Most notably, Intel announced it was suspending its dividend and laying off workers. Its stock fell almost 30% on the news, the largest single-day drop in four decades. Fortunately, portfolios did not have direct exposure to the stock, but we did have exposure to the semiconductor space, which had been performing quite well since last fall until experiencing a sharp two-week decline. Looking at a 15-day period, which would mark the industry’s peak, the semiconductor space has not declined like this since 2020 and 2008. We continue to monitor the sector to see whether a more abrupt rotation away from the exposure may be warranted. Last week, we removed some of this exposure in favor of utilities and real estate-related investments to help dampen volatility. But again, these moves are so swift currently that we’re trying to ease adjustments into portfolios.
The economy has had multiple signs of weakness over the last year, much of which we have discussed before. However, the markets had seemingly ignored this fact until mid-July of this year. Last Wednesday, the Fed held a meeting and kept rates flat. It signaled that a drop would be warranted in September as they believe inflation is cooling, along with the jobs market. The markets initially digested this as positive until the jobs report came out worse than expected. Friday, the jobs report showed unemployment continues to rise, which is what the Fed wanted to see. The market now fully anticipates a rate cut at the next meeting. The “Sahm Rule,” which has been a reliable indicator for predicting a recession, has finally given confirmation after the US saw the economy only add 114,000 jobs when 175,000 were expected and the unemployment rate rose from 4.1% to 4.3%. This is off of a low of 3.4% seen in April of 2023. Interest rates also rolled over, with the 10-year US Treasury yield seeing its largest drop on Friday since 2023.
For portfolios, we’ve started aggressively diversifying outside of tech and Asia-focused investments to soften the volatility. Usually, we only look at these types of rotations monthly. With such extreme and swift gyrations, we’ve had to readdress changes almost weekly, if not daily. Technology was nearly the only sector performing well in mid-July, with the Nasdaq up almost 25% on July 10th. Those gains have now dropped to nearly under 10%, all within a couple of weeks. We witnessed one of the strongest surges of small cap stocks relative to large caps in the first week of July, which has now also almost given up its entire gain. This is happening in days and weeks rather than months and quarters or even years, which is much more typical. Commodities and precious metals have also posed difficulties, seeing large swings in both directions alternating almost daily. It is quite unusual, and we continue to navigate it diligently for clients.
As we look forward to the end of the year, we are approaching a contentious election that will most likely serve as more excuses for continued market volatility. We constantly monitor all events and are looking to balance an approach of not being overly reactive. However, with these current fluctuations continuing, we will have to look to rotate more frequently as the markets change to attempt to ease the volatility being experienced. It is also an important reminder that we’re invested as well, as all staff of F.I.G. have their retirement accounts invested in the same way as clients within our specific risk models.
These are no doubt trying times in more ways than one and we are here to answer any additional questions or concerns you may have. If you have not scheduled a personal review this quarter now would be a good time to do so. We appreciate the privilege to serve each of you and look forward to working together in the years to come.
God Bless,
Your TEAM at F.I.G. Financial Advisory Services, Inc
This update expresses the views of the author(s) as of the date indicated and such views are subject to change without notice. F.I.G. Financial Advisory Services, Inc. (F.I.G.) has no duty or obligation to update the information contained herein. Further, no representation has been made, and it should not be assumed, that past investment performance is an indication of future results. Moreover, wherever there is the potential for profit there is also the possibility of loss. This information is being made available for educational purposes only and should not be used for any other purpose. The information contained herein does not constitute and should not be construed as an offering of advisory services or an offer to sell or solicitation to buy any securities or related financial instruments in any jurisdiction. Certain information contained herein concerning economic trends and performance is based on or derived from information provided by independent third-party sources. F.I.G. believes that the sources from which such information has been obtained are reliable; however, it cannot guarantee the accuracy of such information and has not independently verified the accuracy or completeness of such information or the assumptions on which such information is based. F.I.G. made attempts to show sources and links to that data, when possible. However, F.I.G. cannot guarantee or be held liable when accessing those links, as it is not the property of or maintained by the author(s). This update, including the information contained herein, may not be copied, reproduced, republished, or posted in whole or in part, in any form without the prior written consent of F.I.G.

Uncertainty and Volatility